Aug 15, 2018
There is not a day that goes by where most of us encounter water throughout our day. Besides the need to drink water to survive, water is in our food and drinks, our plumbing, our industrial processes, our weather, and even our bodies. However, the water you encounter is not necessarily clean and pure water. This most crucial resource for living can be tainted by a number of contaminants that unfortunately cannot be seen by the naked eye.
Mar 15, 2016
For a very large proportion of North American homeowners the nuisance and costs associated with hard water just can’t be ignored. Clogged showers, damaged appliances, unsightly scale, and dry skin are just some of the issues that come with hard water. Water softeners provide a much-needed solution to all of these water woes.
Sep 21, 2015
Bottled water is an American staple. You see these bottles everywhere – in the hands of runners and walkers, in people’s cars, at sporting events and concerts, handed out for free at may churches and the list goes on. And while the idea of drinking filtered water is more appealing to many than drinking tap water, what happens to all those bottles once they are used? Many unfortunately end up in landfills.
Aug 21, 2015
Reverse osmosis is most commonly known for its use in drinking water purification and removes large particles and substances using a semi-permeable membrane. The following infographic takes a detailed look at what reverse osmosis is, how it works and some of its applications.

Jul 23, 2015
Here is another infographic that paints a not-so-pretty picture about the water we drink and reinforces the idea of why water treatment products are so important. Think about arsenic, bacteria, and chlorine, just to name a few. Yep they’re all there!
Feb 23, 2015
What’s in your favorite drinking water? Minerals – that’s what! And lots of them. Just how much mineral content does one brand have compared with others? This infographic shows 13 popular brands of drinking water along with their mineral content expressed in parts per million (ppm).
Jan 21, 2015
The contents of tap water vary from state to state across the country. Some of the chemicals found in drinking water will shock and appall you while the excellent quality of others will quench both your worries as well as your thirst. In the following infographic, you will see that the quality of Phoenix’s water is poor. The infographic goes on to show some various ways to filter water and types of filters.
Oct 20, 2014
This infographic highlights how to maintain your private water well and how to keep the water safe for you and your family. While a small percentage, 15% of Americans do not use the public drinking water system and may use resources like wells to supply them with a sufficient water supply.
Jun 16, 2014
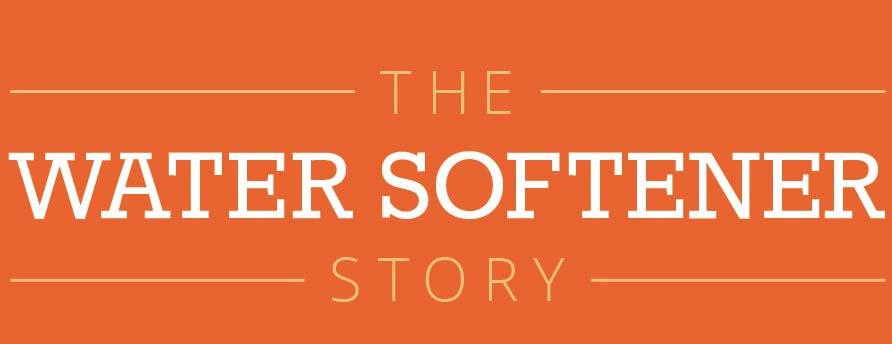
Maybe you have been thinking of how you can save some money? Start by rethinking about grabbing another bottle of water. The way we drink from bottled water may be quite taken-for-granted but consider as well that this seemingly harmful act may actually be turning each one of us into a large contributor to the planet’s growing green problems.
May 15, 2014
On average, the world’s population is growing by 80 million people a year which is increasing demand for fresh water. competition for this water exists all over the world and is only going to increase. Therefore, it is vital that we make a few easy, everyday changes to help reduce water wastage in our homes and workplaces.